

INTRODUCTION
Species diversity is a key indicator of the complexity and health of ecological communities, providing information concerning the richness of interspecific interactions, ecosystem stability and quality of environmental conditions. Ichthyodiversity refers to the variety of fish species as assessed in terms of genotypes within populations and species within communities or aquatic regimes (Burton et al. 1992). India possesses substantial freshwater biodiversity (Mittermeier & Mittermeier 1997), with the Himalayan region having around 500 fish species (Abell et al. 2008). The eastern Himalaya drained by the Brahmaputra has greater diversity of cold water fish than the western Himalayan drainage (Sehgal 1999). According to Abell et al. (2008) the Irrawaddy ecoregion contains more endemic species of freshwater fish (between 119–195) than any of the other eastern Himalayan freshwater ecosystems (Ganga Delta and plains and Chin Hills-Arakan, 28–40 endemics; Ganga Himalayan Foothills, 12–19; Middle and Upper Brahmaputra, 1–11). Kottelat & Whitten (1996) estimated the Ganga River drainage to contain 350 and Brahmaputra and Ayeyarwaddy river drainages to contain 200 fish species respectively. Recently Goswami et al. (2012) published lists of 422 fish species from northeastern India, belonging to 133 genera and 38 families. The eastern Himalaya region is regarded as freshwater biodiversity hotspot (Kottelat & Whitten 1996). The ichthyodiversity of this region is unique from the zoogeographical point of view since the fish fauna represent mostly the Chinese, Malayan and Indian elements of the Oriental realm (Hora & Gupta 1940).
The Darjeeling Himalaya has a pronounced seasonal climate and lies north of the tropical belt between 27013’05”–26017’10”N and 88053’00”–87059’30”E. The spring-fed torrential hill streams of the region represent a unique lotic water ecosystem characterized by rocky and gravely bottoms, high transparency, low temperature, high oxygen level and water velocity, complex flood regimes and seasonal variations in volume of flow (Acharjee & Barat 2011). Sub-tropical regions with monsoon climates experience some of the largest floods on earth, coupled with highly predictable seasonality (Gupta 1987). The Darjeeling Himalaya has five climatic seasons, with the winter and monsoon seasons being the longest. The impact of fishing methods and gear on overall fish diversity (Acharjee & Barat 2010) and diversity of loach and catfishes (Acharjee & Barat 2012) have been studied in the Relli hill-stream, and the ichthyofaunal diversity of the Teesta River in this region (Acharjee & Barat 2013) has also been examined. But to date there have been no studies of seasonal dynamics of density and diversity indices of ichthyofauna in the area. The present study examines the seasonal dynamics of distribution and abundance of fish species in different reaches of the Relli hill-stream. These observations provide insights into seasonal changes and disturbances of the stream ecosystem, which may be helpful in the conservation and management of fish species and formulating fishery policy.
MATERIALS AND METHODS
Study area
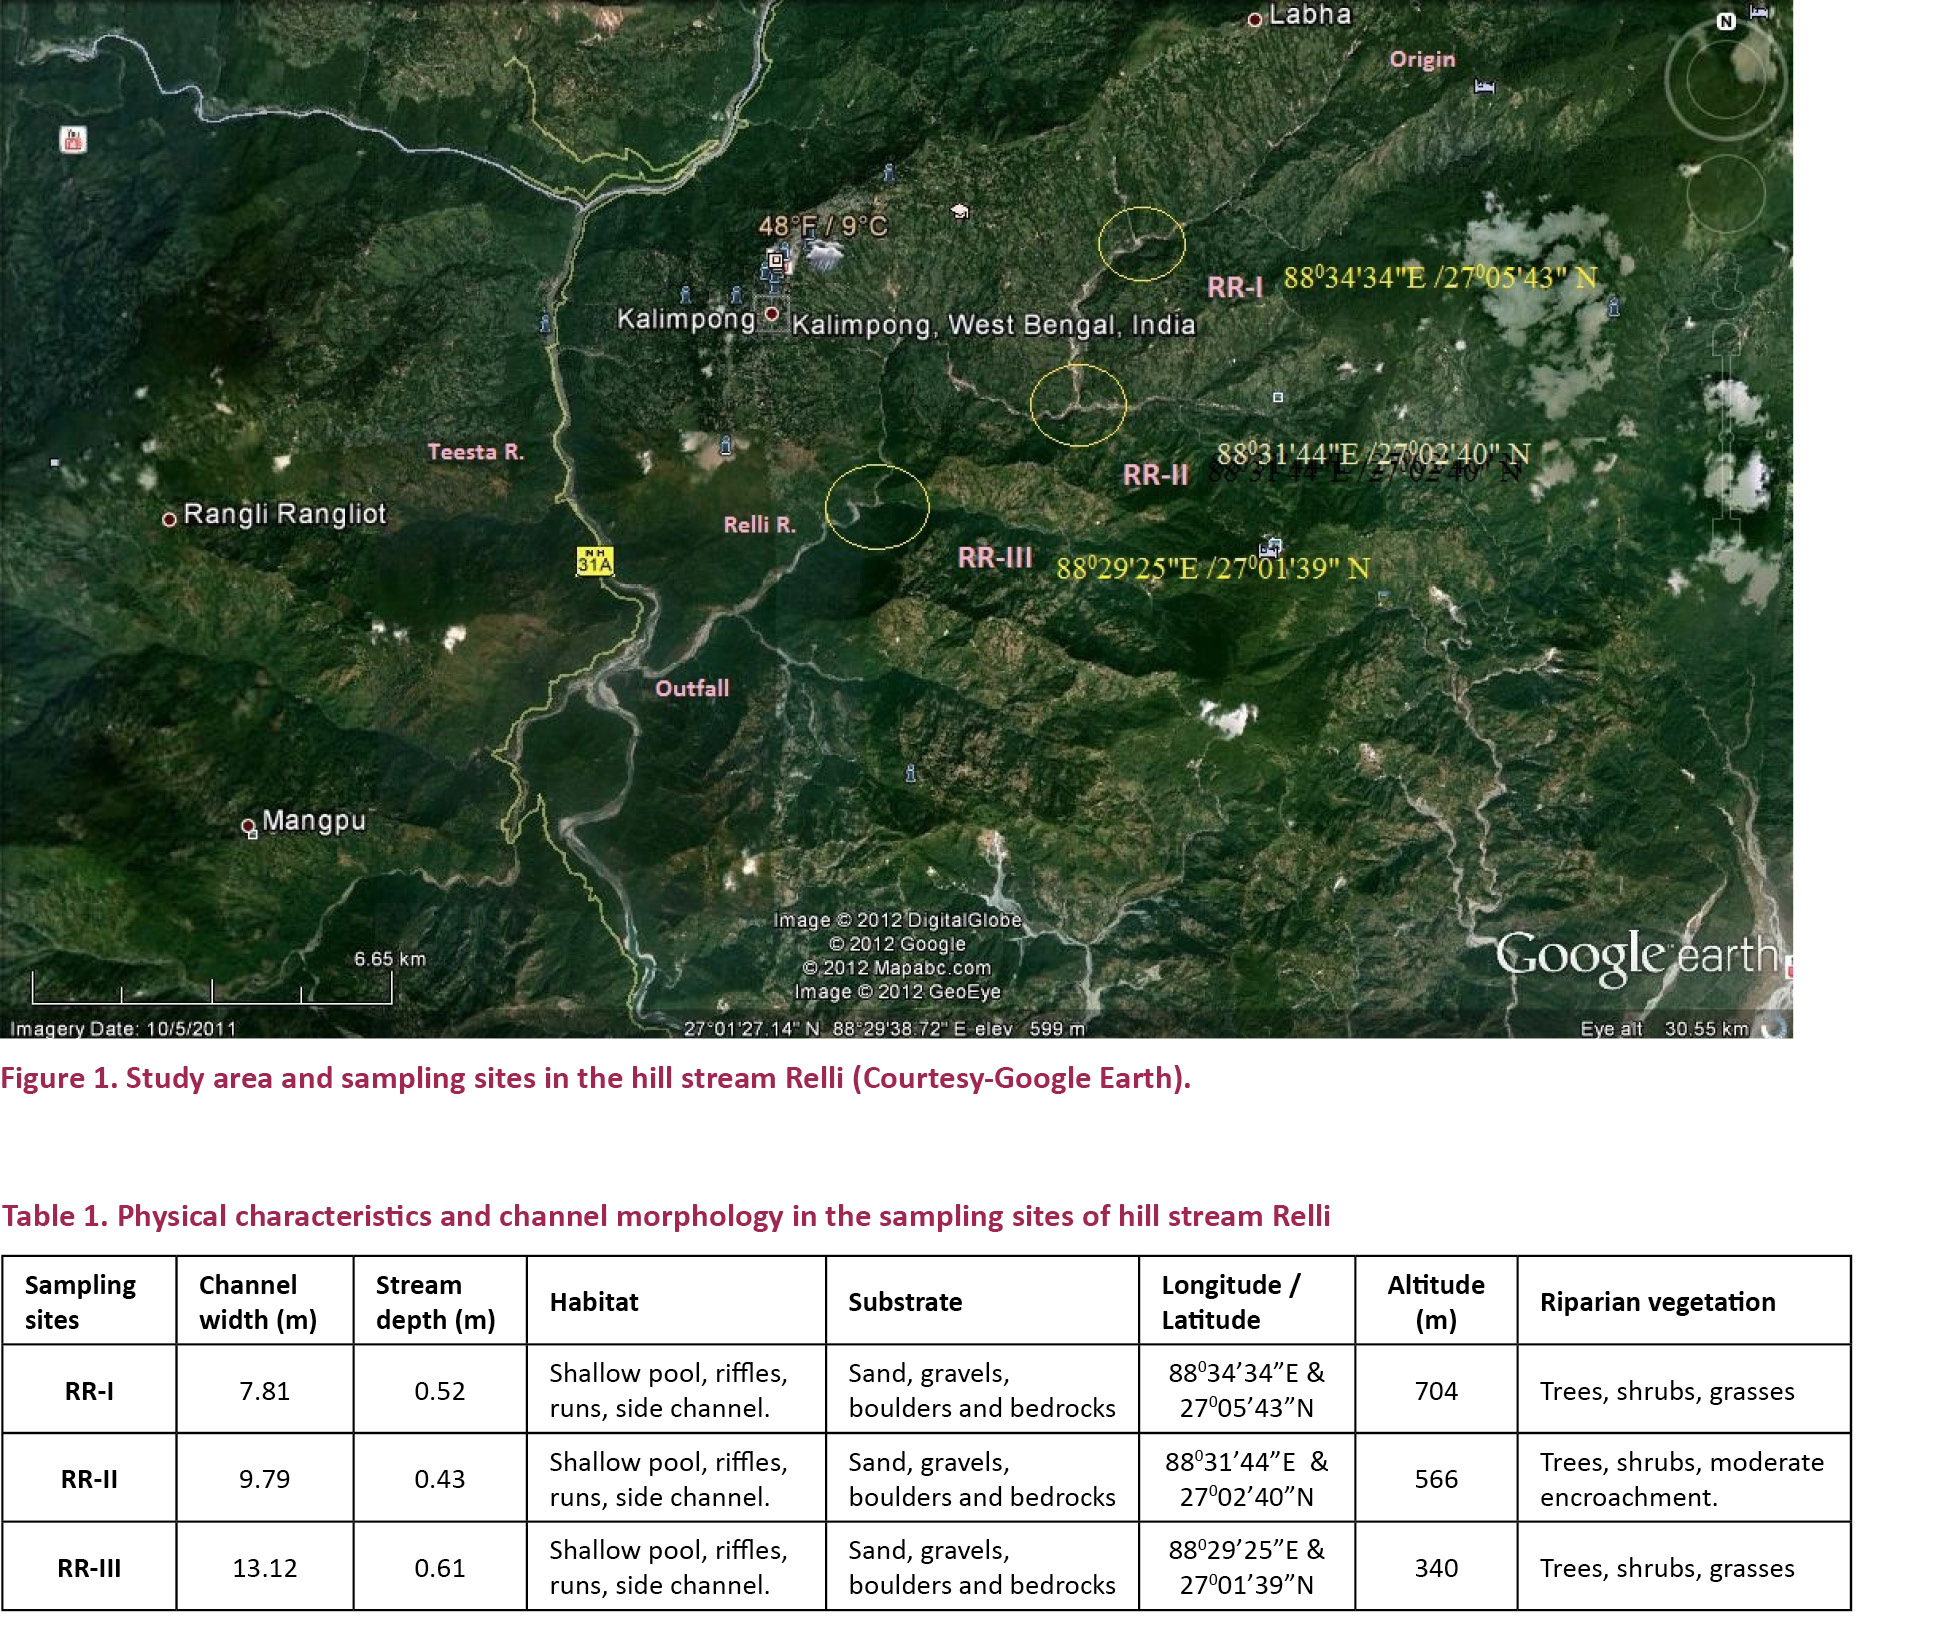
Relli or Rilli is a spring-fed torrential tributary of the River Teesta (Rilli is the Lepcha word for swirling river). The stream originates in the Algarah-Lava ridge of Kalimpong subdivision in the Khampang Reserve Forest at an altitude of about 1800m. The total length of the Relli stream is about 32km (entirely within Kalimpong sub-division) and it joins the Teesta at an altitude of about 212m (Fig. 1). The average width of the stream bed varies from 90–150 m. The longitudinal slope of the stream is about 11m.km-1. The slope of the stream bank varies from 20–900. During monsoon the stream is quite swift but during dry seasons it is greatly reduced. The catchment area of the stream is 165km² and is hilly and well managed. The stream flowing through a gorge is flanked by two ridges. One ridge coming up from Sepkhola-Kamesi forest (300–800 m) traverses across Durpin (1550m), Kalimpong Town (1250m) on its saddle. Then it rises up to Delo (1800m), to Algarah (1900m) and to Labha (2150m) The other ridge arising from Mungpong-Pankhaban forest (250–400 m) leads to Yangmakum (800–1200 m) and further to Charkholey (1600m) from where it meets with its sister ridge arising from Bagrakot (250m) across Nimbong (1000–2000 m). Together they lead to Loleygaon-Kafer (1800–2300 m) and to Labha (2150m).
In this study three sampling stations (RR-I, RR-II and RR-III) were selected for the collection of fish. Physical characteristics and channel morphology (Table 1) and descriptions of sampling sites are as follows: RR-I is located at a distance of 10km from the origin and near the confluence with Payong Khola, this site has little disturbance aside from fishing. RR-II is located 6km from RR-1 near the confluence with Pala Khola, this site is subject to activities like sand and boulder mining, sport and subsistence fishing and car/clothes washing and is a popular picnic spot. RR-III is located 8km from RR-2 near the confluence with Khoni Khola, it is also relatively undisturbed with little fishing activity.
Climate and Seasons
The configuration of neighbouring mountains plays a key role in shaping of the climate of Darjeeling Himalaya. The region has five climatic seasons namely, (i) spring, (ii) summer, (iii) monsoon/rainy, (iv) autumn and (v) winter. These seasons are usually marked from the mid of the months following the English calendar. Spring usually prevails from the mid February to mid April, when the region experiences frequent hail storms and occasional showers. Summer starts mid-April and continues to mid-June with hot weather. The rainy season starts mid-June and lasts until mid-September, during which the district experiences continuous rainfall, thick clouds, fog, mist and high relative humidity. Autumn starts in the latter half of September and lasts until November when winter begins, lasting to mid-February; temperatures can drop below freezing in mountainous regions above 2600m. The lower hill region below 1500m does not receive snowfall, but occasional accumulation of frost is observed. For convenience, the seasons of the study area expressed as pre-monsoon (March, April, May), monsoon (June, July, August), post-monsoon (September, October, November) and winter (December, January, February).
The annual precipitation observed in the first year of study (March 2007 to February 2008) was 2394mm (with 103 rainy days), and in the second year (March 2008 to February 2009) it was 1895 mm (with 89 rainy days). Maximum rainfall occurs during the monsoon months; in the first study year it was 2157mm with 74 rainy days (highest in July 962mm with 29 rainy days), and in second year it was 1615mm with 65 rainy days (highest in August 649mm with 17 rainy days). High rainfall in the entire hilly catchments of the hill stream during monsoon months results in some flooding.
Fish sampling
Monthly sampling was carried out (from March 2007 to February 2009) in the stream in three sampling sites following fishermen or local people who catch fish in this region.
- About 1000m2 of stream channel in each site was blocked by nets and traps (closed population) to prevent movement of fishes in and out of the site.
- Using cast net (Bhureli jal) which is small in size (r =1.2m; weigh about 5kg) having a mesh ranging from 0.5–1.5 cm with an average 1.0cm and covering an area of about 4.5m2, three separate and sequential efforts were made within the blocked stream. Effort (one person, casting nets 25 times, covering an area about 100m2) was kept constant. Following each efforts, captured fish were put into separate bucket with effort number. The catch for efforts 1, 2, 3 was denoted as n1, n2 and n3, respectively.
- In the shallow water rock-striking method was also used. Area of a flat stone was measured for this purpose on which a weighty iron hammer is struck with full force. The intensity, vibration and sound thus produced causes fish to float over water-surface which were hiding under the stone. The fishes were scooped with nets and density calculated and compared with the catches of cast net.
- Other gear and methods including scoop nets, hook and line, various traps (Dhadiya, tip, thokre and thali trap), electro-fishing and water diversion were employed when available. The only species taken into account were those not found in the catches of cast nets.
- Catch per unit effort (CPUE) was expressed as number of fish caught per 100m2of sampling area, here (n1+ n2+ n3)/3/ 100m2.
- The cumulative catch for efforts 1, 2, and 3 were n1, (n1+ n2), (n1+ n2+ n3), respectively. Presented them as Ci, where i=1, 2, 3.
- Removal or depletion estimates (Li & Li 2007) were made by extrapolation of CPUE (y-axis) vs. accumulated catches (x-axis). The population estimate N also calculated using simple linear regression and determining the x-intercept for the cumulative catch. It was expressed as estimated population size of ichthyofauna (N) per 1000m2 of river channel.
CPUE = intercepty – slope x ∑Ci
and, when CPUE = 0, N = intercepty/slope.
- The fish caught were examined for morphological features, colour bands or spots present on the body, recorded in the field along with length and weight. Photographs were taken by digital compact camera (Nikon, coolpix L10). Gut contents were collected for analysis of food habits. Two specimens of each species were taken for identification and their species were ascertained on the basis of morphometric characters and meristic counts following the criteria given by Shaw & Shebbeare (1937), Talwar & Jhingran (1991), Sen (1992), Tekriwal & Rao (1999), Nath & Dey (2000), and Jayaram (2009). Valid scientific names were taken from Fish Base (Froese & Pauly 2012).
Diversity Indices
The following diversity indices were calculated to understand icthyodiversity.
1. Species Richness Index (Margalef’s richness index as modified by Brower & Zar 1977).
S-1
R = -----
1nN
Where, S = total number of species; N = total number of individuals.
2. Shannon-Wiener Diversity index (Krebs 1999).
s
H’ = -∑ pi 1og 2 pi
i=1
Where, H’ = Information content of sample (bits/ individual) = Index of species diversity; S = Number of species; pi = Proportion of total sample belonging to ith species (ni/N); ni = number of individuals of ith species in the sample; N = Total number of individuals in the sample = Σni.
3. Evenness Index (Pielou 1966).
H’
J’ = ---------
1og 2 S
Where, J’ = Evenness index (range 0-1); H’ = Shannon-Wiener diversity index.
4. Index of dominance (Simpson 1949; Whittaker 1972)
s
λ = ∑ pi2
i=1
Statistical analysis
To test for seasonal differences (four seasons namely pre-monsoon, monsoon, post-monsoon and winter) of density and diversity indices of ichthyofauna, one-way ANOVAs and Fisher Least Significant Differences (LSD, a post hoc test) were performed. To account for multiple comparisons Bonferroni correction was applied (using SPSS vers. 16 software).
RESULTS AND DISCUSSION
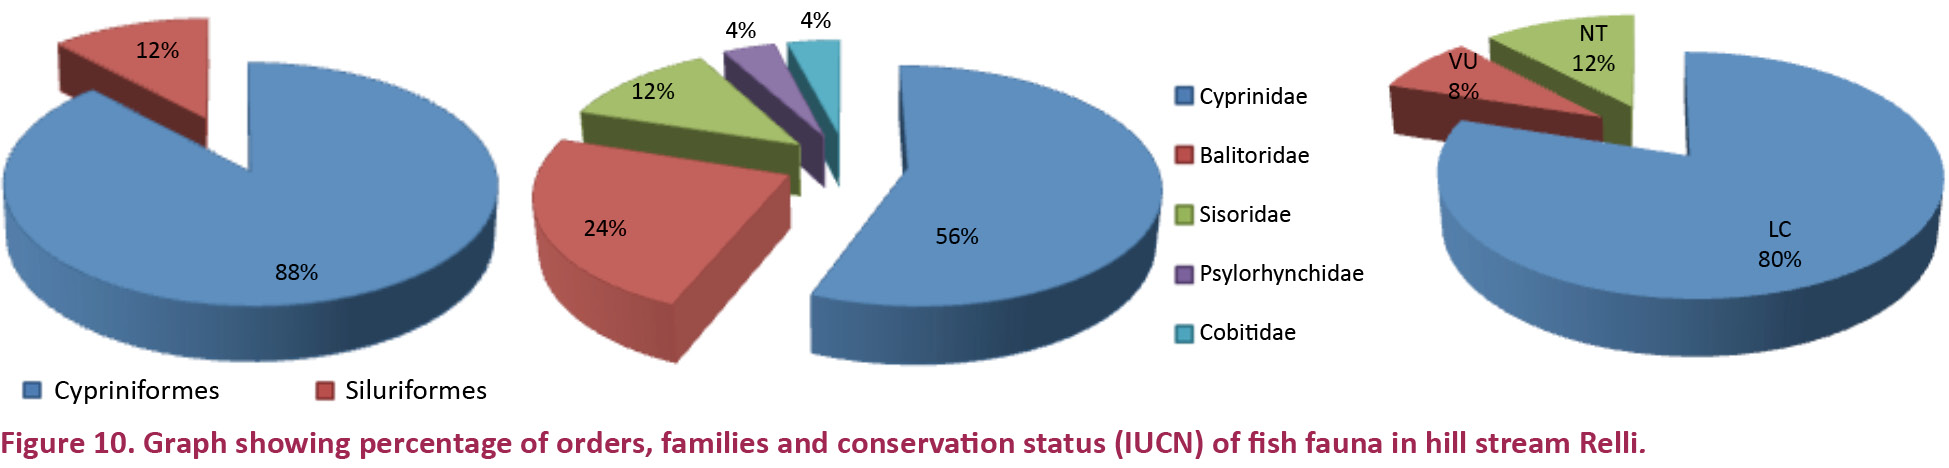
A total of 25 species of fish were recorded from the hill-stream belonging to five families and 16 genera (Tables 2 & 3). The largest number of species (14) were from the family Cyprinidae, followed by Balitoridae (S=6), Sisoridae (S=3), Psilorhynchidae and Cobitidae (one species each). Devario aequipinnatus, Crossocheilus latius, Cyprinion semiplotum, Psilorhynchus sucatio, Acanthocobitis botia, Somileptes gongota, Euchiloglanis hodgarti and Glyptothorax cavia were found only in site RR-III. Barilius shacra and Garra lamta were found in sites RR-II and III, and Schizothorax progastus was found in sites RR-I and II. Twenty-two species (88%) belong to order Cypriniformes and three (12%) to Siluriformes. Nelson (1994) reported the greatest diversity in Cypriniformes and Siluriformes in freshwater habitats, and similar observations were made by Johal & Rawal (2005) in a western Himalayan hill stream, and by Shrestha (1999) in the Nepal region of the Himalayas.
Seven species of fish are abundant (78.6%) in Relli: Neolissochilus hexagonolepis (15.8%), Garra gotyla (14.5%), Barilius bendelisis (14.3%), Schizothorax richardsonii (10.1%), Schistura devdevi (9.8%), Opsarius barna (8.3%), and Schistura scaturigina (5.8%). Analyses of gut contents revealed that Neolissochilus hexagonolepis, Barilius bendelisis and Opsarius barna are omnivorous, feeding on diatoms, filamentous algae, insect larvae etc. Schistura devdevi and S. scaturigina are carni-omnivorous and feed upon insect larvae, crustaceans and algae, whereas Garra gotyla and Schizothorax richardsonii feed upon algae and detritus, and hence are herbivorous. Thus the analysis of the trophic structure indicates dominance of omnivorous fish in all sites, followed by carni-omnivorous and herbivorous fish. Similar findings were reported from Yangtze River basin of China (Fu et al. 2003) and two tropical rivers of India (Das & Chakrabarty 2007). Based on the study of trophic levels it appears that omnivores are the most tolerant of degradation or ecosystem dysfunction because they are able to consume food from a wide variety of sources in a changing ecosystem (Wichert & Rapport 1998). This may be useful to assess the quality of fish habitat.


Almost all species in the collection are represented by very young specimens, adult brood fishes were found mostly during monsoon and post-monsoon months. The array of juveniles and sub adults in this work suggests this stream is probably used as a breeding ground and nursery ground for fish species, particularly of Schizothorax richardsonii, Schizothorax progastus, Neolissochilus hexagonolepis, Neolissochilus hexastichus. Hora & Gupta (1940) found very young fish specimens in Kalimpong duars and Siliguri Terai, and opined that the fish species of this region breed during and after the monsoon months. Hora & Nair (1944) reported mature fish with developed gonads in Riyang stream, a small tributary of the river Teesta in Darjeeling Himalaya, and also found small fry of some species in the same stream. They opined that the Teesta provides a highway for fish migration. However, the absence of adults, among other factors, may be due to pressures exerted from overfishing by local fishermen and/or from downstream migration of fish. Similar observations have been made by Emmanuel & Modupe (2010) in the rivers of Nigeria. Acharjee & Barat (2010) reported that over the years, uncontrolled and often indiscriminate fishing in the largely unmanaged Relli stream has resulted in a sharp decline in catches of important sport and subsistence fish.
It is evident from the present investigation that the ichthyofaunal composition of the 14km stretch (altitudinal variation from 704–340 m) was represented mostly by rheophilic, cold water hill stream species similar to cold water species of Nepal, Sikkim, Bhutan, Assam and other parts of the Indian Himalaya. Dominance of rheophilic, cold water hill stream species may be due to the nature of the stream, which has high water current (ranged from 0.61m sec-1 to 1.51m sec-1 with a mean value of 0.90m sec-1 ±0.24) and gradient, and low water temperature (ranged from 13.30C to 27.80C with amplitude of 14.50C and mean value 21.40C ±3.4) (Acharjee & Barat 2011). From the fishery point of view, water temperature falling with the tolerance limit of trout may be termed cold (Jhingran & Sehgal 1978).
The fast flow of the Relli places constraints on its fish fauna, and the species observed in the present study can be categorised into six major groups on the basis of morphological characteristics enabling them to inhabit torrential streams. These groups are: (a) fish living in shallow clear cold waters in the foothills without obvious modifications to current, such as Barilius spp.; (b) fish inhabiting the bottom water layers in deep fast current with powerful muscular cylindrical bodies, such as Schizothorax spp., Neolissochilus spp.; (c) fish sheltering among pebbles and stones to avoid the strong current, including Crossocheilus latius; (d) fish sheltering among pebbles and shingles in shallows with special attachment structures, such as the loaches, Schistura spp., Canthophrys gongota, Aborichthys elongatus, Acanthocobitis botia; (e) fish that cling to exposed surface of bare rocks in slower current with adhesive organs on their ventral surfaces, such as Garra spp., Glyptothorax cavia, Pseudecheneis sulcata; and (f) fish that cling to the exposed surfaces of bare rocks in fast current having limpet-shaped bodies and mouth, gills and fins highly modified to suit their habitat, such as Parachiloglanis hodgarti. Similar groupings have been recognised by Menon (1954) in Himalayan fish.
The stream has pool-run-riffle geomorphology and high substrate diversity (Bedrock, cobble, gravel, sand and terrestrial litter), and is subjected to seasonal discharge variation including periodic spates and flash-floods during the wet season. Dudgeon (2008) mentioned that high elevation streams in the tropics have fast currents, and are characterized by plunge pools, riffles and rapids dominated by boulders and cobbles, with few or no aquatic macrophytes. The present study revealed that almost all the cyprinid fishes especially Barilius spp, Devario aequipinnatus are generally distributed in the pools, pool edges and in the side pools. Small fry of various fish species such as Barilius spp., Garra spp., Neolissochilus spp., Tor spp., Schizothorax spp., Nemacheilus spp., etc. were found in the side pools. Schistura spp., Aborichthys elongatus were generally abundant in riffle type microhabitat and found under stones.
Of the 25 species, 17 species are considered as food fish, 21 species are ornamental fish, four species namely Schizothorax progastus, S. richardsonii, Neolissocheilus hexagonolepis, N. hexastichus are considered sport fish and are commercially important. References to conservation status of fish species and categories within this paper are based on IUCN (IUCN, 2013) classification. Out of the total species recorded, 20 are Least Concern (LC), two are Vulnerable (VU) and three are Near Threatened (NT). This categorization may be useful for planning conservation strategies for genetic resources of ichthyofauna.
Population size and number of species
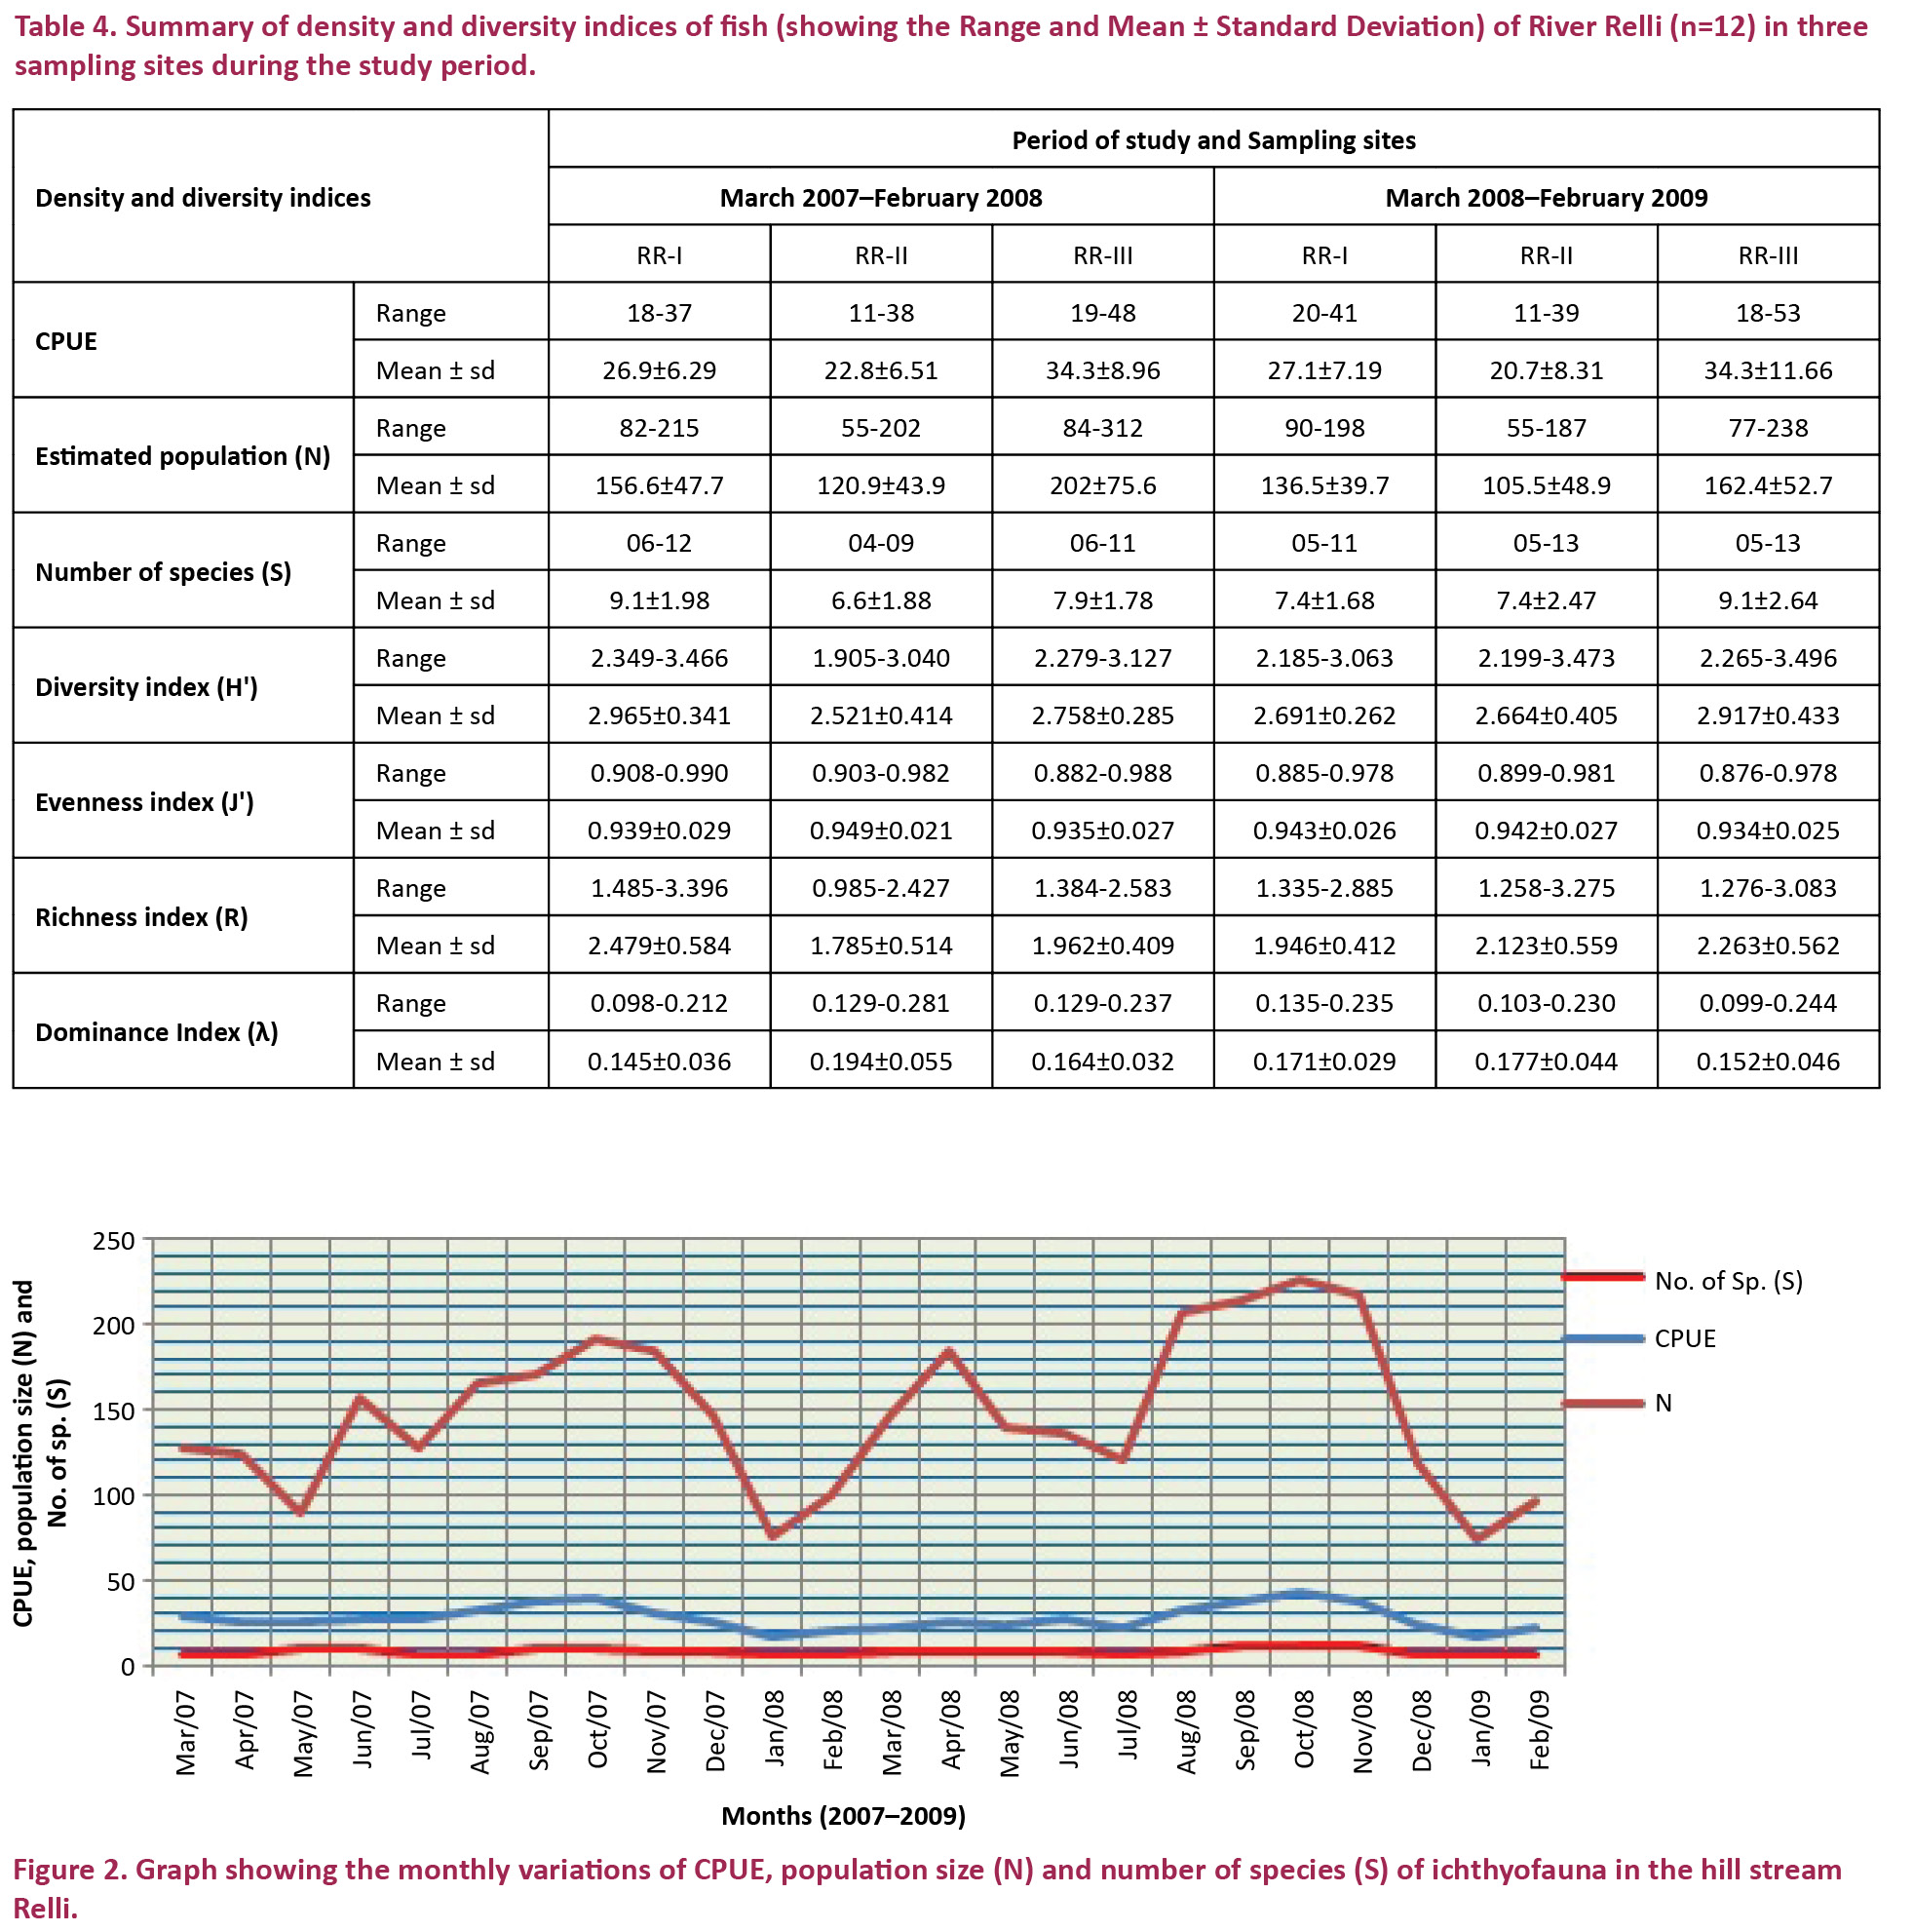
A summary of ichthyofaunal density and diversity observed in the Relli is presented in Table 4. Analyses of monthly data indicated that CPUE, fish population size (N) and number of species (S) increased slightly during April–May and increased sharply during October–November (Fig. 2). Catch per unit effort (CPUE= one person, 25 casting a net covering an area about 100m2) ranged from 11–53 with a mean value 28 (±9.68). Lowest value of CPUE was recorded in June 2008 (RR-II) and in January 2008 (RR-II). Highest value recorded at RR-III during October 2008.
The estimated population size (N) ranged from 55 to 312 individuals with a mean value of 148 (±59.6). Lowest population was recorded in January 2008 at RR-II and in March 2008 at RR-II. Highest population recorded at RR-III during August 2007. The number of species (S) ranged from 4 to 13 with a mean of 8 (±2.2). Lowest number of species was recorded in July 2007 (RR-II), January 2008 (RR-II), and February 2008 (RR-II). Highest number of species recorded at RR-II during November 2008 and at RR-III during September 2008 and October 2008.
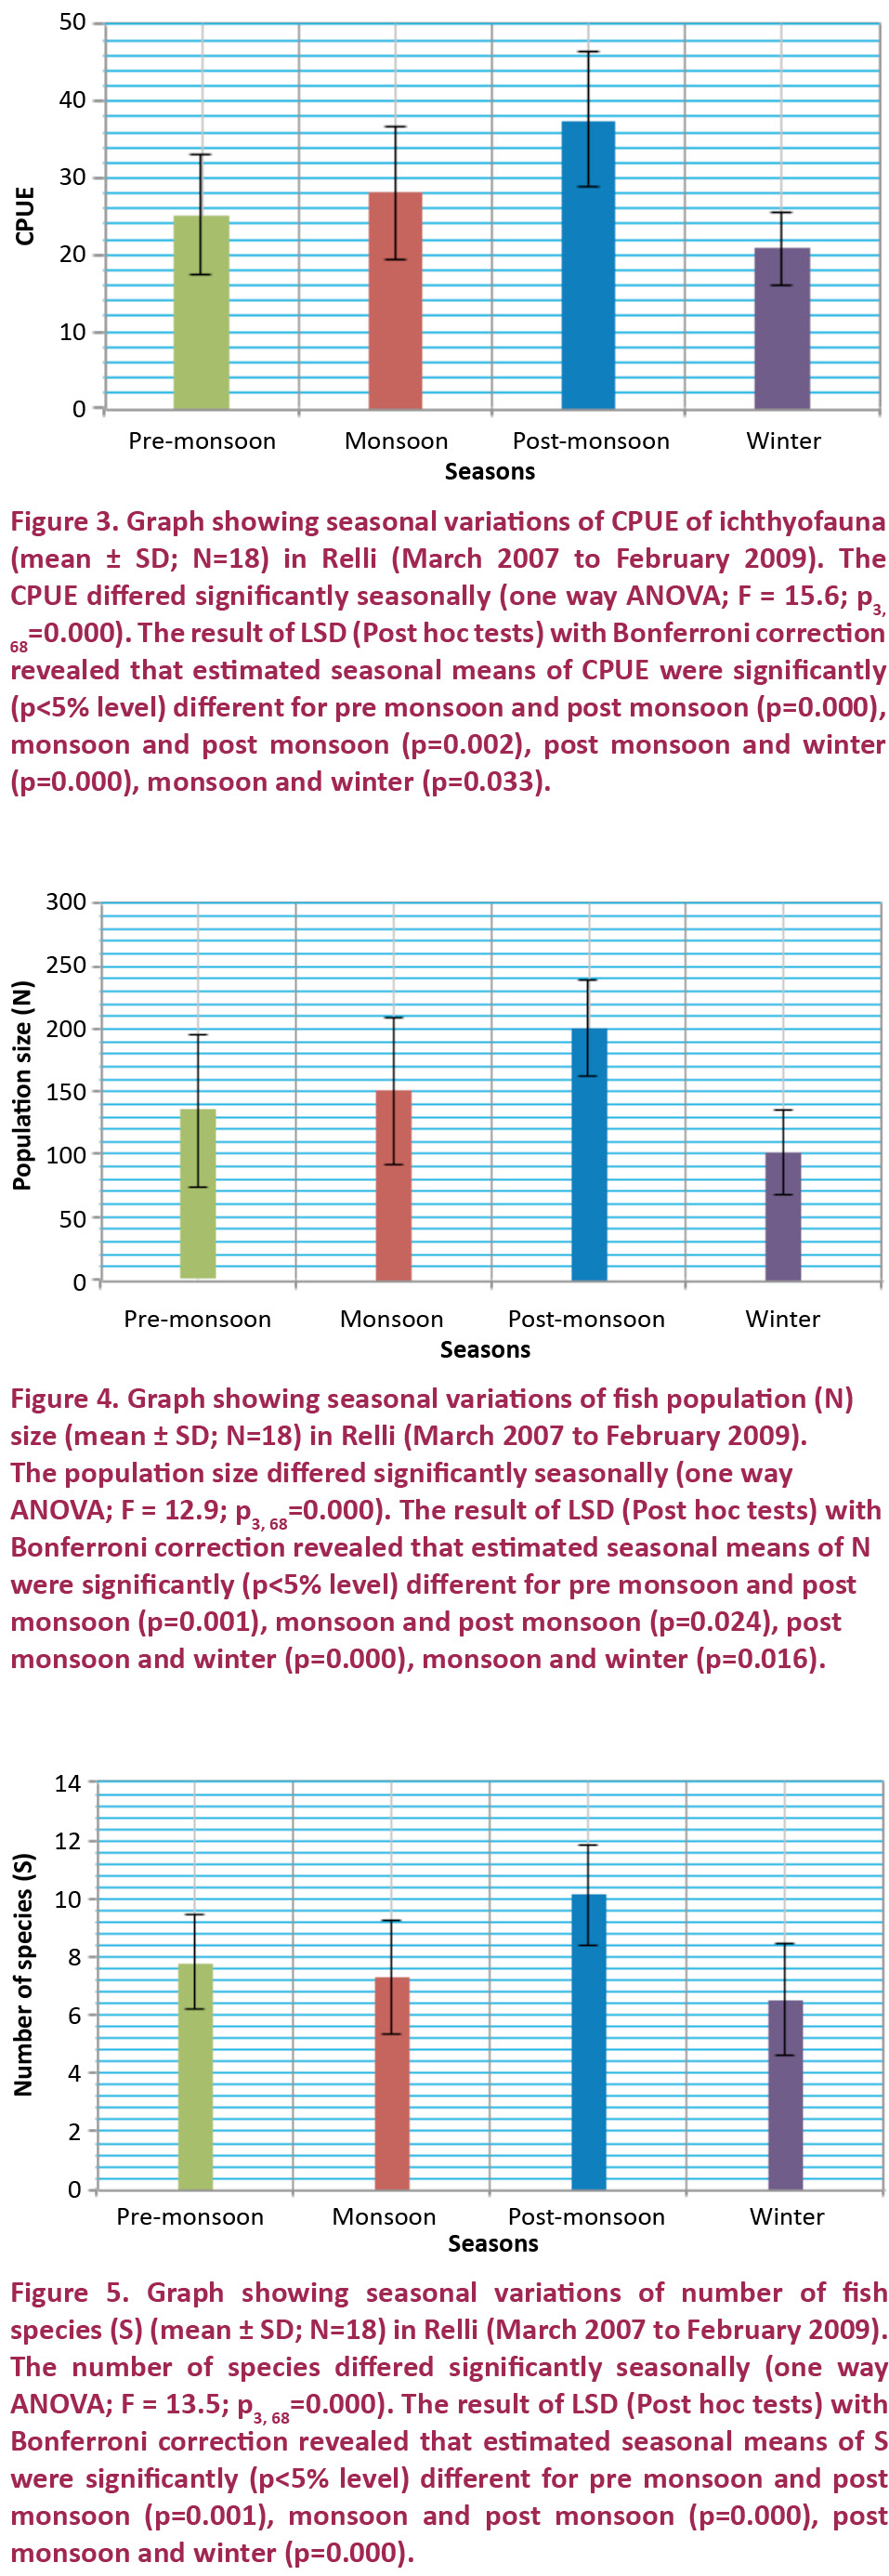
Seasonal variations of CPUE, estimated population size (N) and number of species (S) of fish fauna showed the highest values in post monsoon months at all sites. Lowest values recorded in pre monsoon months (RR-I) and in winter months (RR-II & III). Temperature slowly increased through mid February to mid April and the region experience frequent hail storm (spring season). Based on one way ANOVA, CPUE, estimated population size (N) and number of species (S) showed significant seasonal differences and the results of LSD (post hoc tests) with Bonferroni correction revealed that estimated seasonal means were also significant (Figs. 3, 4 and 5). Increased water temperature during March, April and May (pre monsoon), availability of fish food (macro invertebrates, plankton) may have a role in the slight upraised population and species richness. The Rainy season experiences continuous rainfall, including periodic spates and flash-floods. Increases in discharge during the monsoon (June, July and August) coincided with increased movement and upstream spawning migrations of many adult fishes, such as Schizothorax richardsonii, S. progastus, Neolissochilus hexagonolepis, N. hexastichus, Garra spp., Cyprinion semiplotum etc. Similar spawning migrations occur with increased discharge of rivers in Nepal (Edds 1993) Africa and South America (Lowe-McConnell 1975; Goulding 1980). Hora & Gupta (1940) opined that the fish species of this region breed during and after the monsoon. Spawning and breeding of Katli (Neolissochilus hexagonolepis) season lasts from June to September (Barat et al. 2005). Due to breeding migration and availability of basic fish food items a good variety of fishes attracted to hill stream (Bahuguna & Badoni 2002). A similar opinion has also been given by Singh & Kumar (2000).
Bisht et al. (2009) recorded maximum fish fauna during the monsoon season in a small hill-stream Dangchaura (Takoli) Gad along with River Alaknanda, and this was correlated with the migratory behaviour of some fishes and changes in the physico-chemical nature of river water. But in the present investigation, monsoonal fish yield was low in the hill stream Relli. It may be due to further migration of fishes to tributary streams like Pala, Payong, Khani khola etc. with clear oxygenated water than the Relli during monsoon or it may be due to difficulty in catching fish with cast net in torrential elevated water.
Begossi et al. (1999) opined that during monsoon fish yields decline due to the elevated water level. During the post monsoon (September, October and November) temperature decreases slowly and migratory brood fishes along with year old young begin their downward march to return to winter habitat in Teesta (Sen & Biswas 2006). Huge inputs of allochthonous organic food materials and inorganic nutrients during monsoon enriches the stream and fish spawn grow well during post monsoon. All these factors may operate in a coordinated fashion in low water level, thus diversity and density of ichthyofauna increases post monsoon.
During winter most fishes migrated down stream to winter habitats. At this time, most fishes lie in the deep pools (Sen & Biswas 2006) of either rivers Relli or Teesta. Traps, like tip and thokre, are used during downstream migration of fishes (September to November) thus, most of the juvenile and adult fishes are killed. Hammering, dynamiting, river channel diverting, river poisoning, and electro-fishing are used mainly during winter months in the pools of the river causing indiscriminate killing of fishes (Acharjee & Barat 2010). The dependence on large migratory fish species and seasonal variation in fishing strategies are usual features of river fisheries (Welcomme 1985; Petrere 1989). Two factors, downward migration and indiscriminate fishing may be responsible for low density and diversity during winter months. During 2007–2008, the average value of CPUE (28.00) and estimated fish population size (160 individual/ 1000m2) was found to be slightly higher than 2008-09 (27.63 and 135 individual/ 1000m2). But, the average value of number of fish species (7.97) during 2007–2008 was found to be slightly higher than 2007–2008 (7.86).
Variations in diversity Indices
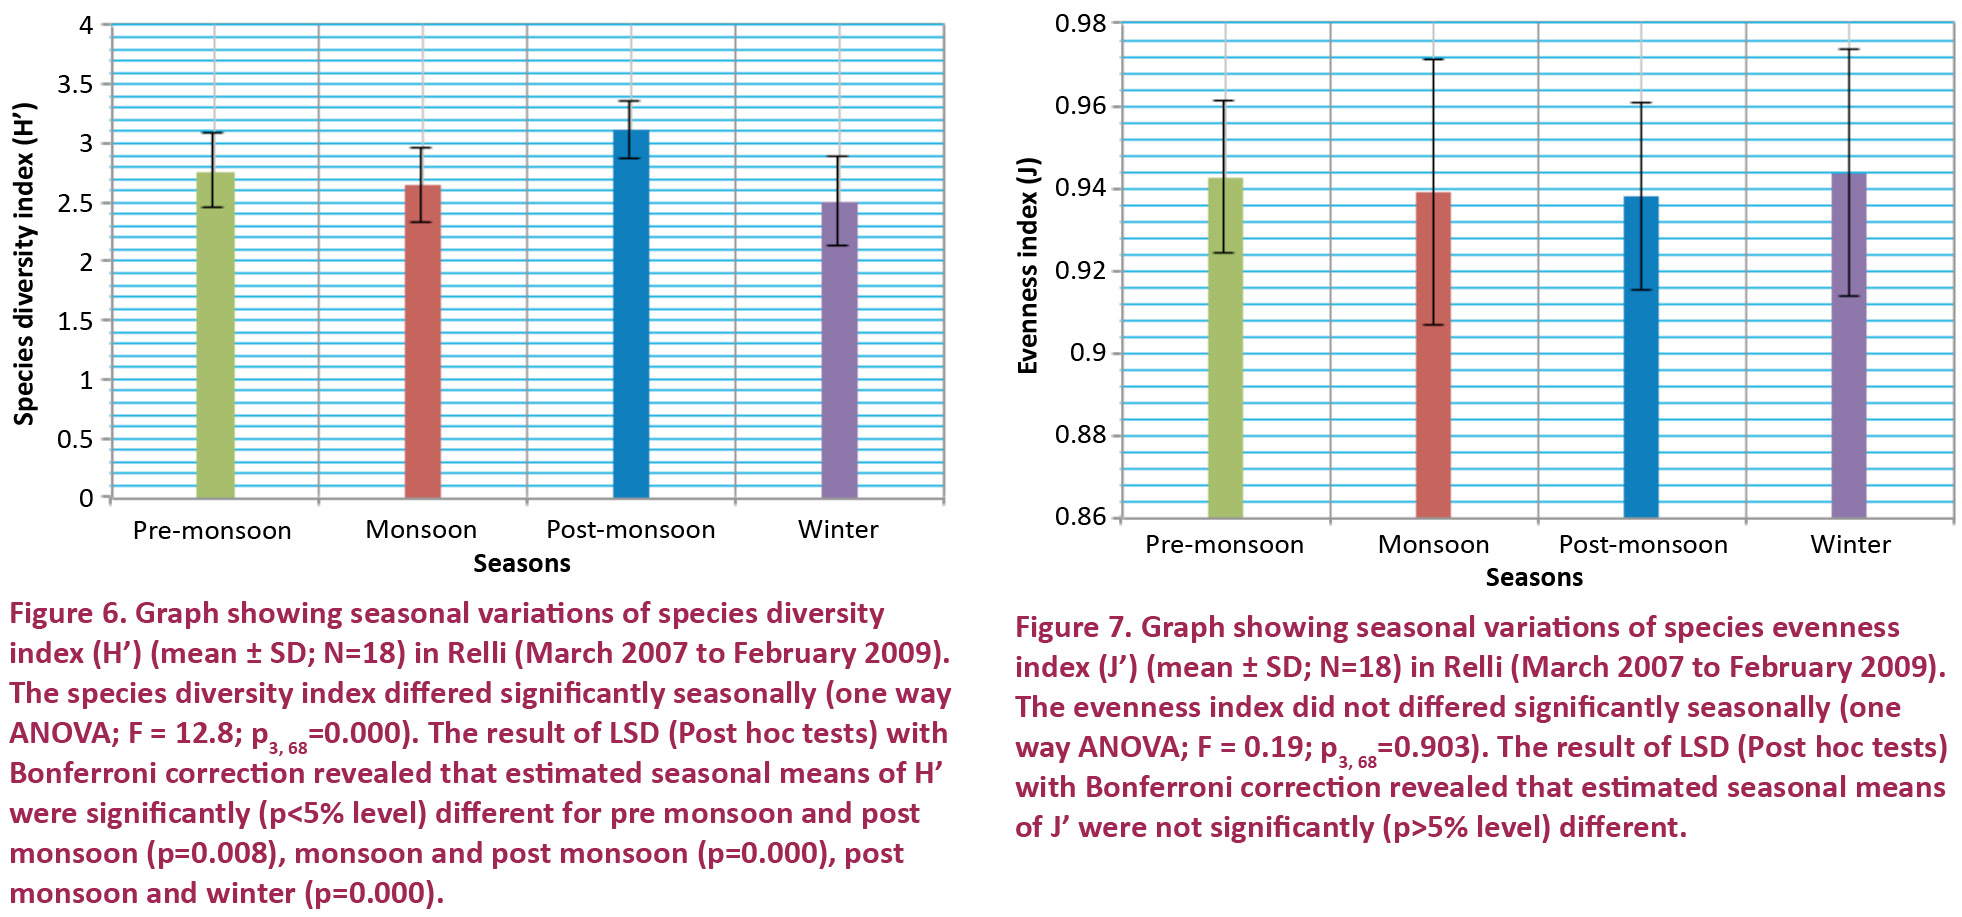
The value of the Shannon-Wiener species diversity index (H’) varies from 0, where the community is composed of single species to 4.5 or 5 bits/individual for the most diversified communities (Faurie et al. 2001). In the present study, the lowest value (1.91 bits per individual) of the S-W index was observed in February 2008 at RR-II, and the highest value (3.50 bits per individual) was recorded at RR-III during September 2008. Seasonal variations of species diversity index of fish show the highest value in post monsoon at all sites and lowest value in monsoon (RR-I) and in winter (RR-II & III). One way ANOVA and the results of LSD (Post hoc tests) with Bonferroni correction revealed that estimated seasonal means of species diversity index were significant (Fig. 6). Margalef (1958) recorded that higher diversity is a clear indication of longer food chains. In Shannon-Wiener legislation, the aquatic environment (soil/water) is classified as – very good when H’ is > 4, good quality 4–3, moderate quality 3–2, poor quality 2–1 and very poor quality <1 (Mishra et al. 2010). Diversity indices are good indicators of pollution in aquatic ecosystems. Diversity index greater than three indicates clean water, values in the range of 1–3 are characteristics of moderately polluted conditions and values less than one characterizing heavily polluted condition (Mason 1988). In the present study average value of S-W diversity index was less than three (i.e., 2.75), therefore water quality in this stretch is poor to moderate in quality and the stream is clean to moderately polluted. Low diversity is reflection of environmental stresses (Hawkes 1979).
Most of the fish communities, as in the present investigation, contain a few dominant species and many species that are relatively uncommon. Evenness measures attempt to quantify this unequal representation against a hypothetical community in which all species are equally common. Pielou (1966) proposed that ‘evenness’ be measured by the ratio between the diversity H’ calculated and that which would be obtained, for the number of species surveyed, in case of equifrequencies. The ratio varies from 0 to 1 (Krebs 1999; Faurie et al. 2001). Pielou’s (1966) evenness index is an excellent measure of “relative evenness”, because it is not independent of richness. But, Ludwig & Reynolds (1988) have reported that evenness indices are more difficult to interpret. In the present study, lowest value (0.88) evenness index was found in December 2008 at RR-III and highest value (0.99) was observed in January 2008 at RR-I. A greater evenness may be biologically equivalent to having more species, since a species that is present in small numbers is unlikely to contribute much to density and diversity. Seasonal variations of evenness index of ichthyofaunal community showed the highest value in winter (RR-I) and in monsoon (RR-II & RR-III). Lowest value found in monsoon (RR-I), post monsoon (RR-II) and in winter (RR-III). A community dominated by relatively few species indicates environmental stress (Plafkin et al. 1989), may be resulted from selective over fishing. Based on one way ANOVA, evenness index was not significant for seasonal differences and the results of LSD (post hoc tests) with Bonferroni correction were also not significant (Fig. 7).
Margalef’s Species richness index is a simple and easily interpretable indicator of biological diversity (Peet 1974). In the present investigation lowest value (0.99) of which was recorded in July 2007 at RR-II and highest value (3.40) was found in May 2007 (RR-I). Seasonal variations of richness index of fish show the highest value in post monsoon months at all sites. Lowest value found in monsoon months (RR-I) and in winter months (RR-II & III). One way ANOVA and the results of LSD (post hoc tests) with Bonferroni correction revealed that estimated seasonal means of species richness index were significant (Fig. 8). Fluctuation of density, number of genera, and S-W species diversity index of fish community have shown similar trend. The species diversity index (H’) and species richness index (R) depend upon the number of species as well as number of individuals in each species and contribute equally to the values of H’ and R (Ludwig & Reynolds 1988). Thus if either of these variables decreases or increases it will affect the overall values of H’ and R.
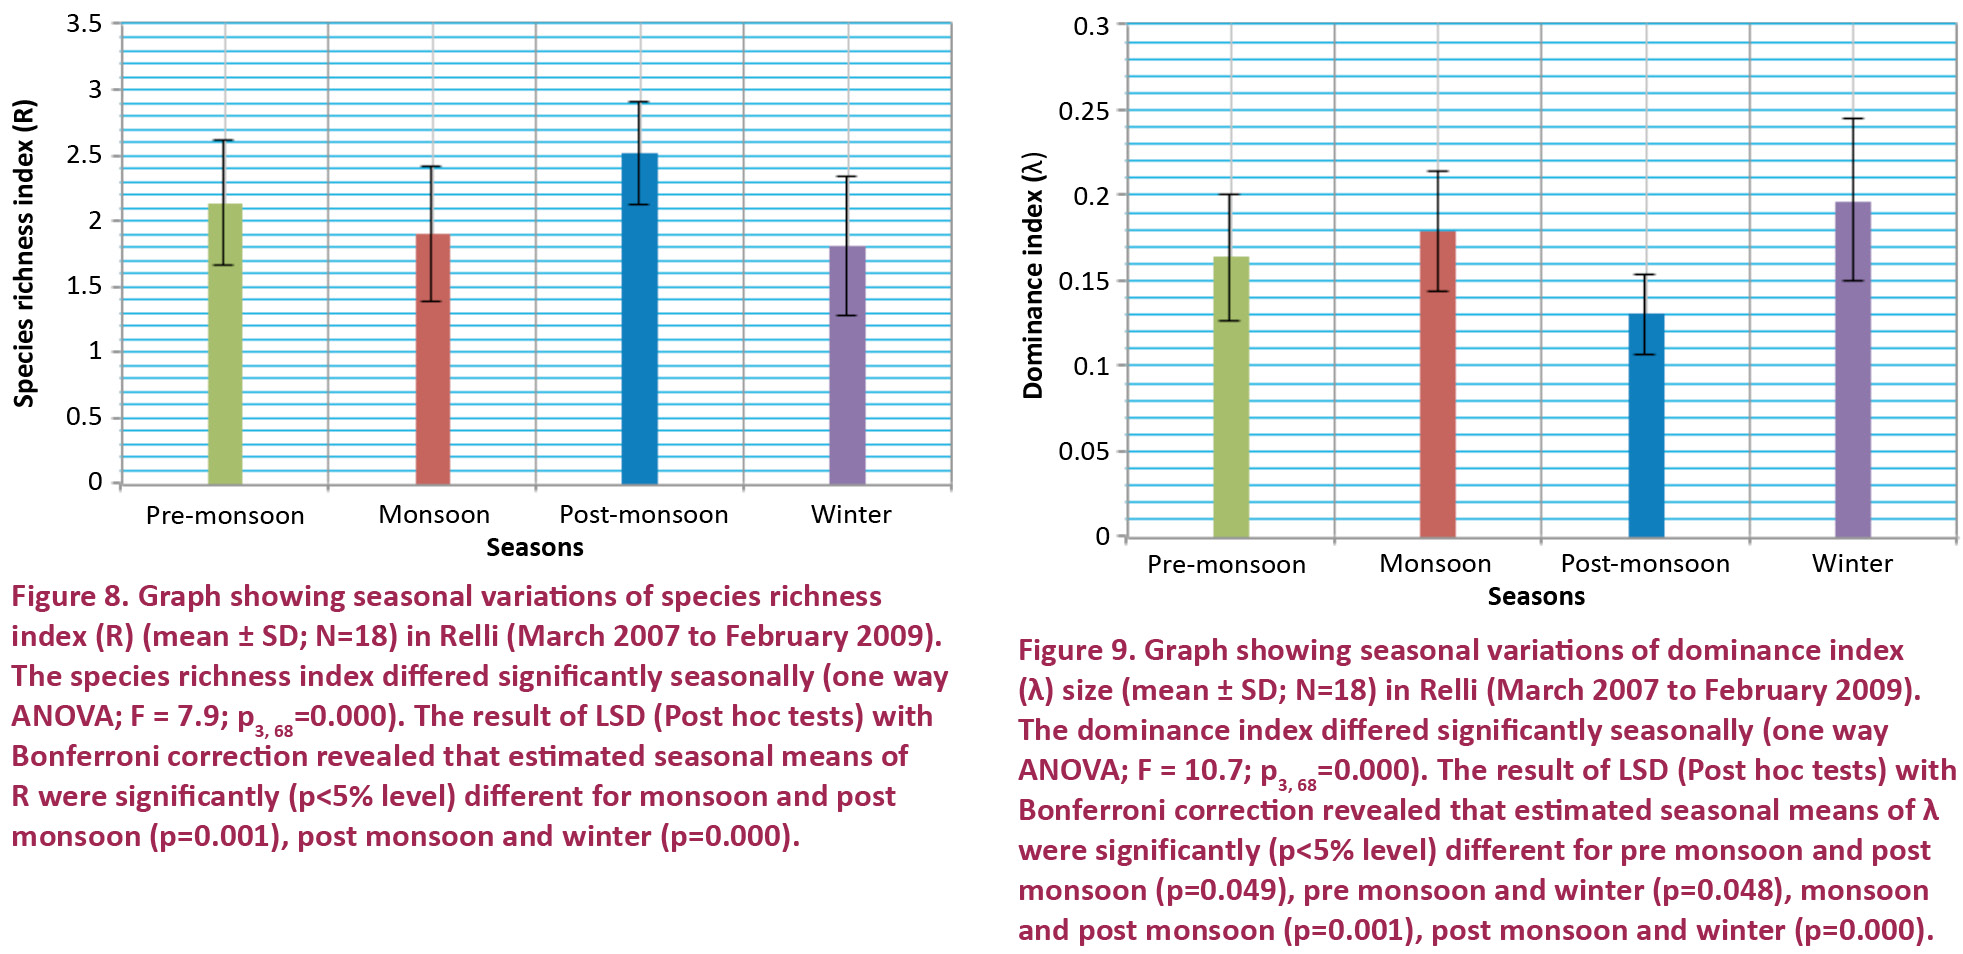
Simpson index measures the strength of dominance, because it weights towards the abundance of the most common species and varies inversely with species diversity (Whittaker 1972). A value of this index ranges from 0-1; zero represents no dominance and 1, for maximum dominance; viz: only one species in the sample (Berger & Parker 1970). In the present study, value of dominance index (λ) of fish community was lowest (0.10) in December 2007 at RR-I and highest value (0.28) of index of dominance was found in February 2008 at RR-II. Seasonal variations of index of dominance of fish show the highest value in monsoon months at RR-I and in winter months at RR-II and III. Lowest value found in post monsoon months at all sites. One way ANOVA and the results of LSD (Post hoc tests) with Bonferroni correction revealed that estimated seasonal means of dominance index were significant (Fig. 9). According to Whittaker (1963) the value of dominance index is always higher where the community is dominated by a fewer number of species and when the dominance is shared by a large number of species. This agrees with the present study. Higher value of dominance index in the hill stream was registered during the monsoon periods. The present investigation also indicates that, whenever dominance index of ichthyofaunal community was higher the evenness index was lower and vice versa (Watling et al. 1979).
In the present study, annual variation of density and diversity indices of ichthyofaunal community in the stream showed slight fluctuation. During 2007–2008, the average value of fish CPUE (28.0), estimated population size (160), evenness index (0.94) and index of dominance (0.17) was found to be slightly higher than 2008–2009 (i.e., 27.6, 135, 0.94 and 0.17 respectively). But, the average value of ichthyofaunal number of genera (7.97), S-W diversity index (2.76), and richness index (2.11) during 2008–2009 was found to be slightly higher than 2007–2008 (i.e., 7.86, 2.75 and 2.08 respectively). Slight annual variation of density and diversity indices of ichthyofaunal community in the stream indicated that seasonal variations might occur year after year in a predictable manner, unless affected by large scale natural or anthropogenic disturbances.
Along the elevational gradient (i.e., along RR-I, RR-II and RR-III) average value of density and diversity indices (Table 4) like CPUE, estimated population size (N), Number of genera (S), Species diversity index (H’), and Species richness index (R) of zooplankton community showed decreasing tendency with the increase of altitude in the selected stretch of hill stream Relli, but on the contrary evenness index (J’) increased with the increase of altitude and index of dominance (λ) for fish community highest value (0.19) at RR-II, other two sites have same values (0.16). Altitude is frequently correlated with changes in diversity (Lomolino 2001). The density and diversity of fish assemblages along the gradient of the hill stream Relli is in agreement with the “river continuum concept” involving energy sources and allocation (Vannote et al. 1980), i.e., at lower altitudes, there are higher amounts of energy available because of more solar radiation, more resources (for example, minerals and water); as a result, even higher levels of species richness can be allowed at lower altitudes. Interestingly, in the present investigation the values of CPUE, N, S, H’, d of ichthyofaunal community were recorded lowest at RR-II, but on the contrary values of J’ and λ were found highest. Anthropogenic disturbances like sand and boulder mining, car and cloth washing and intensive fishing activities may affect adversely the ichthyofaunal density and diversity at RR-II of the hill stream.
CONCLUSION
This study provides data concerning the dynamics of ichthyofaunal density and diversity in a section of spring-fed torrential hill stream in the Darjeeling Himalaya. Our results show that the density and diversity of ichthyofauna in the stream varied seasonally in a highly predictable manner. Density and diversity indices of ichthyofauna of the hill stream were found to vary significantly, with pronounced and predictable seasonality of the region. Evenness index (J’) of ichthyofaunal population showed no significant relation with seasonality. The variations of evenness index may be regulated by other factors like selective fishing.
In the present study slight annual variations of CPUE, population size, number of species, S-W species diversity index, evenness index, richness index and index of dominance of ichthyofaunal community in the stream indicated that seasonal variations might occur year after year in a predictable manner. Monsoonal floods in such areas qualify as disturbances, and spates and periodic scouring floods displace aquatic organisms, increase mortality (especially on juveniles), move sediments and restructure habitats, decrease the availability of benthic food resources and influence on the intensity of biotic interactions involving fishes (Dudgeon 2000). The natural diversity of fish species complicates the impacts of flooding on stream fish assemblages. Certain fish species benefit from and depend upon seasonal or periodic flooding. Monsoonal floods coordinate natural systems by providing environmental cues for spawning and migration processes of fish fauna (Poff & Ward 1989; Leitman et al. 1991). Numerous studies have concluded that juvenile life stages are particularly susceptible to heavy losses during extreme floods in high-gradient systems (Hoopes 1975; Jowett & Richardson 1989), and large numbers of young fish are lost during average seasonal flooding in systems where the timing of high flows coincides with fragile life stages (Nehring & Miller 1987). Killing and displacement of fish stock by cyclones and cloudbursts in Darjeeling Himalaya river systems have been reported by O’Malley (1907), Sen & Biswas (2006), Mukherjee et al. (2011). Thus the ichthyodiversity of the Himalayan region appears to have evolved in the context of seasonality, geomorphology, natural disturbances and physico-chemical aspects of stream waters and recently, anthropogenic activity altering existing balances has become a major cause of habitat alteration and fish stock depletion.
Nevertheless, it can still be said that our study area is not polluted, and that it continues to be an excellent fishery resource for indigenous varieties of hill stream fish with ornamental, food and sport value. Thus the unique ichthyofauna of the Darjeeling Himalaya is a valuable natural endowment, meriting efforts to educate people about the importance of safeguarding its rivers, streams, biodiversity and fish productivity.
REFERENCES
Abell, R., M.L. Thieme, C. Revenga, M. Bryer, M. Kottelat, N. Bogutskaya, B. Coad, N. Mandrak, S.C. Balderas, W. Bussing, M.L.J. Stiassny, P. Skelton, G.R. Allen, P. Unmack, A. Naseka, R. Ng, N. Sindorf, J. Robertson, E. Armijo, J.V. Higgins, T.J. Heibel, E. Wikramanayake, D. Olson, H.L. Lopez, R.E. Reis, J.G. Lundberg, M.H.S. Perez & P. Petry (2008). Freshwater ecoregions of the World: a new map of biogeographic units for freshwater biodiversity conservation. Bioscience 58(5): 403–414; http://dx.doi.org/10.1641/B580507
Acharjee, M.L. & S. Barat (2010). Impact of fishing methods on conservation of ichthyofauna of river Relli in Darjeeling Himalaya of West Bengal. Journal of Environmental Biology 31: 431–434.
Acharjee, M.L. & S. Barat (2011). Spatio-temporal Dynamics of Physico-Chemical Factors of River Relli in Darjeeling Himalaya, West Bengal, India. North Bengal University Journal of Animal Sciences 5: 24–33.
Acharjee, M.L. & S. Barat (2012). Diversity of loach and catfish in a Darjeeling Himalayan hill-stream - their prospects as ornamental fish and constraints. NBU Journal of Animal Science 6: 53–60.
Acharjee, M.L. & S. Barat (2013). Ichthyofaunal Diversity of Teesta River in Darjeeling Himalaya of West Bengal, India. Asian Journal of Experimental Biological Sciences 4(1): 112-122.
Bahuguna, S.N. & A.K. Badoni (2002). Qualitative and quantitative productivity of fish food from three important tributaries of river Alaknanda. Himlayan Journal of Environmental Zoology 16(2): 215–222.
Barat, S., P. Jha & R.F. Lepcha (2005). Bionomics and cultural prospects of Katli, Neolissocheilus hexagonolepis (McClelland) in Darjeeling district of West Bengal, pp. 66–69. In: Tyagi, B., S. Sunder & M. Mohun (eds.). Coldwater Fisheries Research and Development in North-east Region of India. NRCCWF, Bhimtal. Vikrant Computers, Haldwani.
Begossi, A., R.A.M. Silvano, B.D. do Amaral & O.T. Oyakawa (1999). Uses of fish and game by inhabitants of an extractive reserve (Upper Juruá, Acre, Brazil). Environment, Development and Sustainability 1: 73–93; http://dx.doi.org/10.1023/A:1010075315060
Berger, W.H. & F.L. Parker (1970). Diversity of planktonic Foramenifera in deep sea sediments. Science 168: 1345–1347; http://dx.doi.org/10.1126/science.168.3937.1345
Bisht, B., A.K. Badoni & S.N. Bahuguna (2009). Seasonal distribution and relative abundance of fish fauna of a small hill-stream Dangchaura (Takoli) Gad, along the river Alaknanda. Our Nature 7: 182–186.
Brower, J.E. & J.H. Zar (1977). Field and Laboratory Methods for General Ecology. W.M.C. Brown Co. Publication, Dubuque, Iowa.
Burton, P.J., A.E. Balinsky, L.P. Coward, S.G. Cumming & D.D. Kneeshaw (1992). The value of managing for biodiversity. The Forestry Chronicle 68 (2): 225-237.
Das, S.K. & D. Chakrabarty (2007). The use of fish community structure as a measure of ecological degradation: a case study in two rivers of India. Bio Syst. 90: 188–196.
Dudgeon, D. (2000).The ecology of tropical Asian rivers and streams in relation to biodiversity conservation. Annual Review of Ecology and Systematics 31: 239–263.
Dudgeon, D. (Ed.) (2008). Tropical Stream Ecology. Academic Press is an imprint of Elsevier, U.K. 316pp.
Edds, D.R. (1993). Fish Assemblage Structure and Environmental Correlates in Nepal‘s Gandaki River. Copeia (1): 48–60.
Emmanuel, L.O. & O.O. Modupe (2010). Fish Diversity in Three Tributaries of River Ore, South West, Nigeria. World Journal of Fish and Marine Sciences 2(6): 524–531.
Faurie, C., C. Ferra, P., Medori & J. Devaux (2001). Ecology Science and Practices. Oxford & IBH Publishing Co. Pvt. Ltd. New Delhi.
Froese, R. & D. Pauly (eds.) (2012). FishBase. World Wide Web electronic publication. www.fishbase.org, version (08/2012).
Fu, C., J. Wu, J. Chen, Q. Wu & G. Lei (2003). Fresh water fish biodiversity in the Yangtze River basin of China: patterns, threats and conservation. Biodiversity and Conservation 12: 1649–1685.
Goswami, U.C., S.K. Basistha, D. Bora, K. Shyamkumar, B. Saikia & K. Changsan (2012). Fish diversity of north east India, inclusive of the Himalayan and In Burma biodiversity hotspots zones: A checklist on their taxonomic status, economic importance, geographical distribution, present status and prevailing threats. International Journal of Biodiversity and Conservation 4(15): 592-613. http://dx.doi.org/10.5897/IJBC11.228
Goulding, M. (1980). The Fishes and The Forest. University of California Press, Berkeley.
Gupta, A. (1987). Large floods as geomorphic events in the humid tropics, pp. 301–315. In: Baker, V.R., R.C. Kochel, & P.C. Patton (eds.). Flood Geomorphology. John Wiley & Sons, New York.
Hawkes, H.A. (1979). Invertebrates as indicator of river water quality, pp. 16–30. In: James, A., L. Evison (eds.). Biological indicators of Water Quality. John Wiley and Sons. Great Britain.
Hoopes, R.L. (1975). “Flooding as the result of Hurricane Agnes, and its effects on a native brook trout population in an infertile headwater stream in central Pennsylvania.” Transactions of the American Fisheries Society 104(1): 96–99.
Hora, S.L. & J.C. Gupta (1940). On a Collection of Fish from Kalimpong Duars and Siliguri Terai, northern Bengal. Journal Royal Asiatic Society of Bengal Science 7(8): 77–83.
Hora, S.L. & K.K. Nair (1944). Pollution of Streams and conservation of fisheries; effluent of the quinine factory at Mongpo, District Darjeeling, Bengal. Current Science 10(1): 147–164.
IUCN (2013). IUCN Red List of Threatened Species. Version 2013.1. <www.iucnredlist.org>. Downloaded on 04 July 2013.
IUCN (2012). IUCN Red List of Threatened Species. Version 2012.1. <www.iucnredlist.org>. Downloaded on 04 July 2013.
Jayaram, K.C. (2009). Catfishes of India. Narendra Publishing House. Delhi (India), 383pp.
Jhingran, V.G. & K.L. Sehgal (1978). Cold water Fisheries of India. 1st edition. Inland Fisheries Society of India, Barrackpore, West Bengal, India, ix+239pp.
Johal, M.S. & Y.K. Rawal (2005). Key to the management of the western Himalayan Hill streams in relation to fish species richness and diversity. Hydrobiologia 532: 225–232; http://dx.doi.org/10.1007/s10750-004-9523-3
Jowett, I.G. & C. Richardson (1989). Effects of a severe flood on in stream habitat and trout populations in seven New Zealand rivers. New Zealand Journal of Marine and Freshwater Research 23: 11–17; http://dx.doi.org/10.1080/00288330.1989.9516335
Kottelat, M. & T. Whitten (1996). Freshwater Biodiversity in Asia with Special Reference to Fish. World Bank, Washington, D.C.
Krebs, C.J. (1999). Ecological Methodology - 2nd Edition. Addison Wesley Longman.
Leitman, H.M., M.R. Darst & J.J. Nordhaus (1991). Floodplain of the Ochlockonee River, Florida, during flood and drought conditions. U.S. Geological Survey, Water Resources Investigations (90-4202), Tallahassee, Florida.
Li, H.W. & J.L. Li (2007). Role of fish assemblages in stream communities. In: Hauer, F.R. & G.A. Lamberti (eds.). Methods in Stream Ecology, 2nd Edition. Academic Press, USA, 489–514.
Lomolino, M.V. (2001). Elevation gradients of species-density: historical and prospective views. Global Ecology & Biogeography 10: 3–13; http://dx.doi.org/10.1046/j.1466-822x.2001.00229.x
Lowe-McConnel, R.H. (1975). Fish communities in Tropical Freshwaters. Longman, New York, New York.
Ludwig, J.A. & J.F. Reynolds (1988). Statistical Ecology. A Primer on Methods and Computing. A Wiley-Interscience Publication. John Wiley and Sons, U.S.A., 338pp.
Margalef, D.R. (1958). Information Theory in Ecology. General Systems 3: 36–71.
Mason, C.F. (1988). Biology of Fresh Water Pollution. Longman scientific and technical.
Menon, A.G.K. (1954). Fish geography of the Himalayas. Proceedings of the National Institute of Science of India 20: 467–493.
Mishra, A., S.K. Chakraborty, A.K. Jaiswar, A.P. Sharma, G. Deshmukhe & M. Mohan (2010). Plankton diversity in Dhaura and Baigul reservoirs of Uttarakhand. Indian Journal Fisheries 57(3): 19–27.
Mittermeier, R.A. & C.G. Mittemeier (1997). Megadiversity: Earth’s Biologically Wealthiest Nation, pp. 1–140. In: McAllister, D.E., A.L. Hamilton & B. Harvery (eds.). Global Freshwater Biodiversity. Sea Wind, Cemex, Mexico City.
Mukherjee, M., R.F. Lepcha & C. Chakraborty (2011). Fish and Fisheries of Himalayan and Terai Region of West Bengal with Ornamental Touch. Daya Publishing House. Delhi, 342pp.
Nath, P. & S.C. Dey (2000). Fish and Fisheries of Northeastern India (Arunachal Pradesh). Narendra Publishing House. Delhi (India), xviii+217pp.
Nehring, R.B. & D.D. Miller (1987). The influence of spring discharge levels on brown and rainbow trout recruitment and survival, Black Canyon of the Gunnison River, Colorado, as determined by IFIM, PHABSIM models. Proceedings Annual Conference, Western Association of Fish and Wildlife Agencies. Salt Lake City, Utah, 388–397pp.
Nelson, J.S. (1994). Fishes of the World, 3rd Edition. John Wiley & Sons, New York.
O’Malley, L.S.S. (1907). Bengal District Gazetteer: Darjeeling. Rept. Logos Press, New Delhi, 1985pp.
Peet, R.K. (1974). The measurement of species diversity. Annual Review of Ecology and Systematics 5: 285–307. http://dx.doi.org/10.1146/annurev.es.05.110174.001441
Petrere Jr., M. (1989). River fisheries in Brazil: a review. Regulated Rivers: Research & Management 4: 1–16; http://dx.doi.org/10.1002/rrr.3450040102
Pielou, E.C. (1966). The measurement of diversity in different types of biological collections. Journal of Theoretical Biology 13: 131–144. http://dx.doi.org/10.1016/0022-5193(66)90013-0
Plafkin, J.L., M.T., Barber, K.D., Poter, S.K., Gross & R.M. Highes (1989). Rapid bioassessment protocol for use in streams and rivers for benthic macro invertebrates and fish. EPA/ 444/4-89/001. Office of water regulation and standards. U.S. Environmental Protection Agency,Washingaton DC, USA.
Poff, N.L. & J.V. Ward (1989). Implications of streamflow variability and predictability for lotic community structure: A regional analysis of streamflow patterns. Canadian Journal of Fisheries and Aquatic Science 46: 1805–1818; http://dx/doi.org/10.1139/f89-228
Sehgal, K.L. (1999). Coldwater fish and fisheries in the Himalayas: Rivers and Streams, pp. 41–63. In: Petr, T. (ed.). Fish and Fisheries at higher altitude-Asia. FAO Fisheries Technical Paper. No. 385: Rome, FAO.
Sen, P.K. & S.N. Biswas (2006). Development strategies of cold water fisheries in Darjeeling hill areas of West Bengal, pp. 24–48. In: Proceedings of State Level Seminar on Prospects and Potentialities of Cold Water Fisheries in West Bengal Jointly organized by Department of Fisheries, Aquaculture, Aquatic resources, and Fishing harbours, Government of West Bengal and Department of Zoology, University of North Bengal, Siliguri.
Sen, T.K. (1992). Freshwater Fish. State Fauna Series 3: Fauna of West Bengal, Part 2, Zoological Survey of India: 101–242.
Shaw, G.E. & E.O. Shebbeare (1937). The fishes of Northern Bengal. Journal Royal Asiatic Society of Bengal. Science 3: 1–137.
Shrestha, J. (1999). Coldwater fish and fisheries in Nepal, pp. 13–40. In: Petr, T. (ed.). Fish and Fisheries at Higher Altitude-Asia. FAO Fisheries Technical Paper. No. 385: Rome, FAO.
Simpson, E.H. (1949). Measurement of diversity. Nature 163: 688; http://dx.doi.org/10.1038/163688a0
Singh, H.R. & N. Kumar (2000). Some aspects of ecology of hillstreams, stream morphology, zonation, characteristics, and adaptive features of ichthyofauna in Garhwal Himalaya, pp. 1–18. In: Munshi, J.S.D. (ed.). Modern Trends in Fish Biology Research. Narendra Publishing House, Delhi.
Talwar, P.K. & A.G. Jhingran (1991). Inland Fishes of India and adjacent countries - 2 Volumes. Oxford & IBH Publishing House, New Delhi, xx+1158pp.
Tekriwal, K.L. & A.A. Rao (1999). Ornamental Aquarium Fish of India. Waterlooville, Kingdom Books, 144pp.
Vannote R.L., G.W. Minshall, K.W. Cummins, J.R. Sedell & C.E. Cushing (1980). The river continuum concept. Canadian Journal of Fisheries and Aquatic Sciences 37: 130–137; http://dx.doi.org/10.1139/f80-017
Watling, K., G. Bottom, A. Pembroke & D. Maurer (1979). Seasonal variations in Delaware Bay phytoplankton community structure. Marine Biology 53: 207–215; http://dx.doi.org/10.1007/BF00398134
Welcomme, R.L. (1985). River fisheries. FAO Fish Tech Pap. 262: 1–318.
Whittaker, R.H. (1972). Evolution and measurement of species diversity. Taxon 21: 213–251.
Wichert, G.A. & D.J. Rapport (1998). Fish community structure as a measure of degradation and rehabilitation of riparian systems in an agricultural drainage basin. Environmental Management 22(3): 425–443.